Spreads
Spreads
Spreads
Spreads
Spreads
USDJPY consolidates the biggest daily gains in a month following the US Retail Sales and Michigan Consumer report.
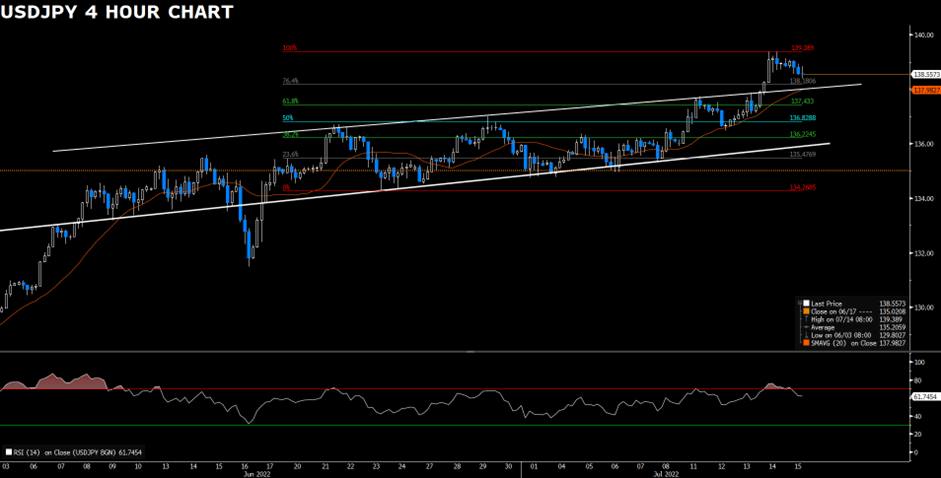
Technical speaking, USDJPY trades in the range of 138.18(76.4% of the Fib. Retracement) and 139.38(100% of the Fib. Retracement.) USDJPY witnesses some profit taking after contesting the resistance level of 139.38, the highest in 21 years. The corrective pullback erodes a part of the previous day’s strong gain. The intraday bias remains strongly bullish as the pair continues to trade above the ascending channel and above the 20 Simple Moving Average. On the downside, the breakout of the immediate support of 138.18 and the 20 Simple Moving Average would pressure USDJPY’s buyers, attracting some follow-through sellers. However, as long as USDJPY can trade above 136.22, the overall momentum remains upside.
Resistance: 139.38
Support: 137.88, 136.63, 135.77
Gold steadies above $1,700 during the American session as falling US Treasury yields help limit further losses on gold.
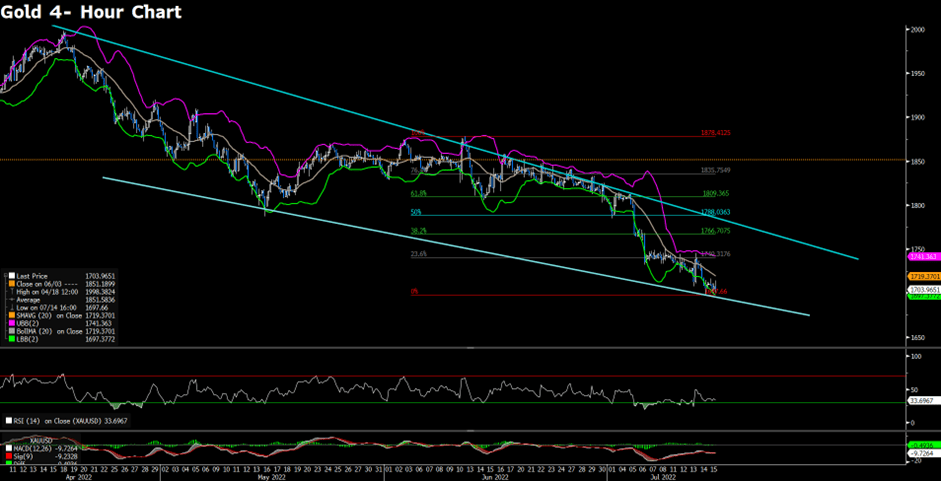
From the technical perspective, the intraday outlook of gold stays negative. Still, the psychological support of $1,700 seems to warrant some caution for bearish traders before positioning for any further drop. That being said, if the support fails to defend, then it is expected to see an accelerated decline in gold. On the contrary, gold needs to climb above $1,788 to declare its upside momentum on the four-hour chart. As the RSI indicator and the MACD remain hovering in the negative territory, the downward trajectory could further get extended.
Resistance: 1740.31, 1766.70, 1788.03
Support: 1697.66
EURUSD extends its rebound above 1.0050 during the American session on Friday. The euro-dollar eases some selling pressure as the bet on a 100 bps interest rate hike from the Fed declines.
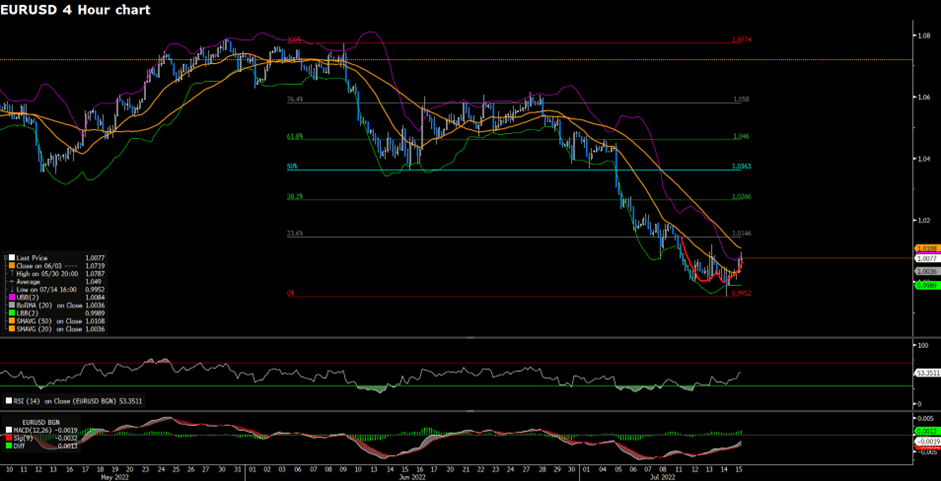
From the technical perspective, EURUSD is moving outside the descending regression on the four-hour chart. EURUSD looks to build some upside momentum following the trading pattern of double-bottom. At the time of writing, EURUSD is expected to contest the resistance of 1.0146. In the meantime, the RSI indicator on the four-hour chart has surpassed the midline, suggesting that buyers are gradually back in the game.
Resistance: 1.0146, 1.0266, 1.0363
Support: 1.0000, 0.9952
Note: The information is provided for reference purposes only and doesn’t take into account your personal objectives, financial circumstances, or needs, and does not constitute investment advice. We encourage you to seek independent advice if necessary. VT Academy will not accept liability for any loss or damage, including without limitation to, any loss of profit, which may arise directly or indirectly from the use of or reliance on such information.