Spreads
Spreads
Spreads
Spreads
Spreads
This week the focus is still on the latest updates between Russia and Ukraine, from the war side and the trade side, apart from the employment data from the US, which coincides with the first day of April, which is likely to be the starting point for movement in the monthly candle.
In other news, the GDP in Canada and Core PCE Price Index in USD will also influence market movements.

WTI (USOUSD) was up 8.44%, Bitcoin (BTCUSD) was up 7.97%, and AAPL Shares were 6.28% higher.
Meanwhile, USDJPY rose by 2.57%, and XAUUSD rose as much as 1.85%.
In the US Index, the SP500 was up by 1.72% and NAS100 by 2.31%. (Data taken from MT4 VT Markets).
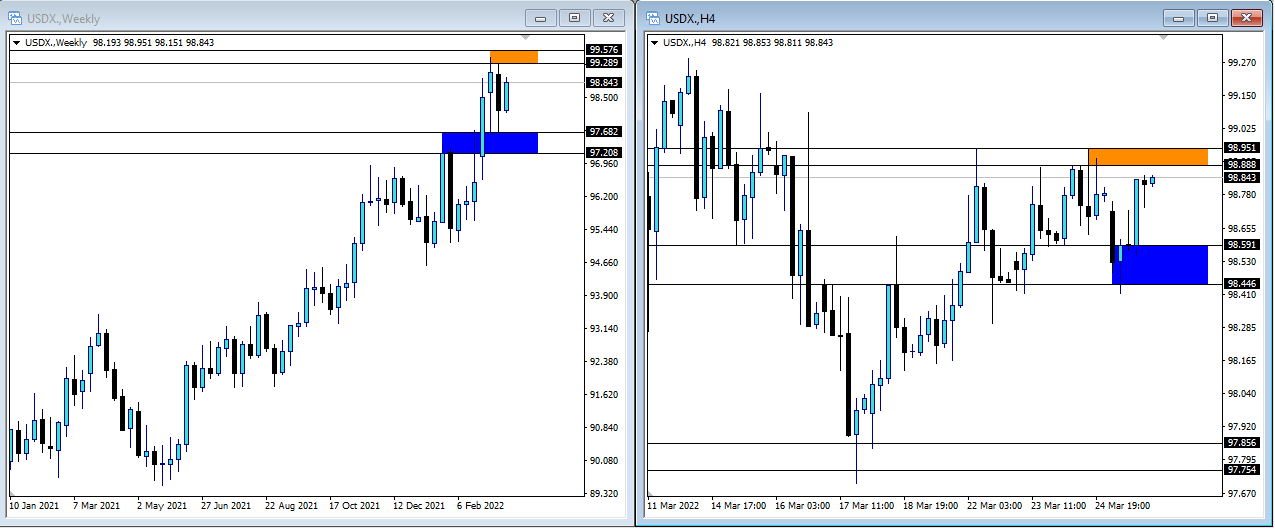
Last week, the USD Index displayed growth after weakening in the previous week and is currently in a consolidative area.
In the Weekly Timeframe, we can see that the USD Index is still in the area between the Support 97,208 – 97,682 and the resistance area at 99,289 – 99,576.
Meanwhile, on the H4 timeframe, we can see that the USD Index is trying to go up and catch up to break the resistance area at 98.888 – 98.951 with the support area at 98.446 – 98,591.
Gold also looked flat last week with a movement that is not too big, although the trend is still up.
If we look at the weekly timeframe, Gold is trying to break through again to enter the resistance area of $1965 – $1993 with support at the area of $1891 – $1916.
While on the H4 timeframe, we can see that the main objective for Gold is the level of $1974, with a potential to reach $2000 and Support area at $1942 – $1949.
